
Contingency tables.

Contingency tables are described for the most common studies: cross-sectional, case-control, and cohort studies.
There’re plenty of tables. And they play a great role throughout our lives. Perhaps the first one that strikes us during our early childhood is the multiplication table. Who doesn’t long, at least the older of us, how we used to repeat like parrots that of two times one equals two, two times… until we learned it by heart?. But, as soon as we achieved mastering multiplication tables we bumped into the periodic table of the elements. Again to memorize, this time aided by idiotic and impossible mnemonics about some Indians who Gained Bore I-don’t-know-what.
But it was through the years that we found the worst table of all: the foods composition table, with its cells full of calories. This table pursues us even in our dreams. And it’s because eating a lot have many drawbacks, most of which are found out with the aid of other table: the contingency table.
Contingency tables
Contingency tables are used very frequently in Epidemiology to analyze the relationship among two or more variables. They consist of rows and columns. Groups by level of exposure to the study factor are usually represented in the rows, while categories that have to do with the health problem that we are investigating are usually placed in the columns. Rows and columns intersect to form cells in which the frequency of its particular combination of variables is represented.
The most common table represents two variables (our beloved 2×2 table), one dependent and one independent, but this is not always true. There may be more than two variables and, sometimes, there may be no direction of dependence between variables before doing the analysis.
Simpler 2×2 tables allow analyzing the relationship between two dichotomous variables. According to the content and the design of the study to which they belong, their cells may have slightly different meanings, just as there will be different parameters that can be calculated from the data of the table.
Cross-sectional studies
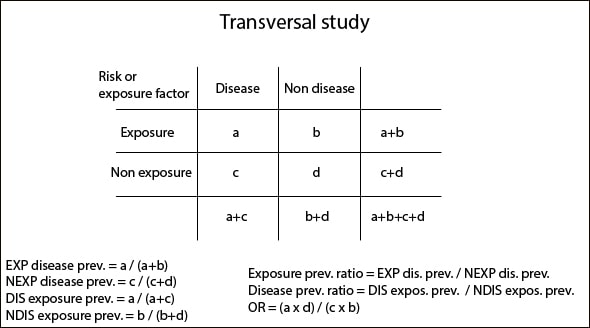
The frequency measures are the prevalence of disease among exposed (EXP) and unexposed (NEXP) and the prevalence of exposure among diseased (DIS) and non-diseased (NDIS). These prevalences represent the number of sick, healthy, exposed and unexposed in relation to each group total, so they are rates estimated in a precise moment.
The measures of association are the rates between prevalences just aforementioned according to exposure and disease status, and the odds ratio, which tells us how much more likely the disease will occur in exposed (EXP) versus non-exposed (NEXP) people. If these parameters have a value greater than one it will indicate that the exposure factor is a risk factor for disease. On the contrary, a value equal or greater than zero and less than one will mean a protective factor. And if the value equals one, it will be neither fish nor fowl.
Finally, as in all types of tables that we’ll mention, you can calculate statistical significance measures, mainly chi-square with or without correction, Fisher’s exact test and p value, unilateral or bilateral.
Case-acontrol studies
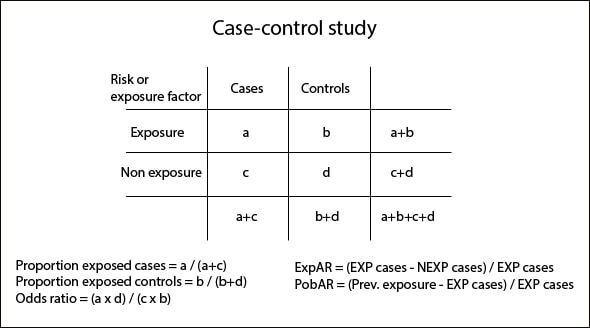
The measures of frequency that we can calculate are the proportion of exposed cases (based on the total number of cases) and the proportion of exposed controls (based on the total number of controls). Obviously, we can also come up with the proportions of non-exposed calculating the complementary values of the aforementioned ones.
The key measure of association is the odds ratio that we already know and in which we are not going to spend much time. All of us know that, in the simplest way, we can calculate its value as the ratio of the cross products of the table and that it informs us about how much more likely is the disease to occur in exposed than in non-exposed people. The other measure of association is the exposed attributable fraction (ExpAR), which indicates the number of patients who are sick due to direct effect of exposition.
Managing this type of tables, we can also calculate a measure of impact: the population attributable fraction (PopAR), which tells us what would happen on the population if we eliminated the exposure factor. If the exposure factor is a risk factor, the impact will be positive. Conversely, if we are dealing with a protective factor, its elimination impact will be negative.
With this type of study design, the statistical significance measures will be different if we are managing paired (McNemar test) or un-paired data (chi-square, Fisher’s exact test and p value).
Cohort studies
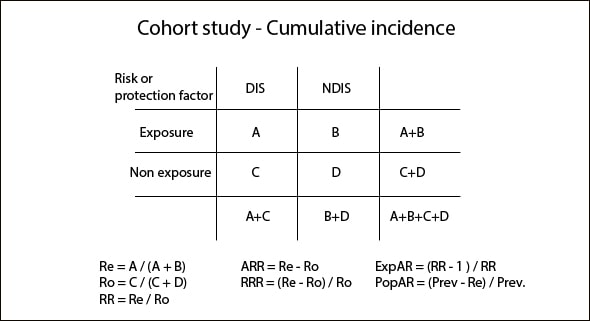
Tables from cumulative incidence studies (CI) are similar to those we have seen so far. Disease status is represented in columns and exposure status in rows. Otherwise, incidence density (ID) tables represent in the first column the number of patients and, in the second column, the follow-up in patients-years format, so that those with longer follow-up have greater weight when calculating measures of frequency, association, etc.
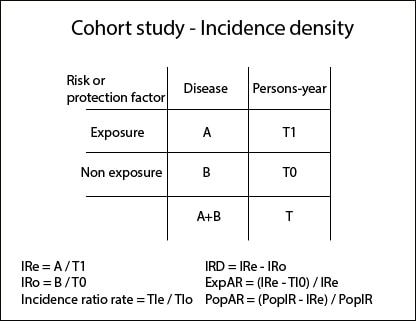
We can calculate the ratios of the above measures to come up with the association measures: relative risk (RR), absolute risk reduction (ARR) and relative risk reduction (RRR) for CI studies and incidence density reduction (IRD) for ID studies. In addition, we can also calculate ExpAR as we did in the cases-control study, as well as a measure of impact: PopAR.
We can also calculate the odds ratios if we want, but they are generally much less used in this type of study design. In any case, we know that RR and odds ratio are very similar when disease prevalence is low.
To end with this kind of table, we can calculate the statistical significance measures: chi-square, Fisher’s test and p value for CI studies and other association measures for ID studies.
As always, all these calculations can be done by hand, although I recommend you to use a calculator, such as Calcupedev. It’s easier and faster and further we will come up with all these parameters and their confidence intervals, so we can also estimate their precision.
We’re leaving…
And with this we come to the end. There’re more types of tables, with multiple levels for managing more than two variables, stratified according to different factors and so on. But that’s another story…