
Sample size for estimating a proportion

The sample size required to estimate a population proportion depends on the desired level of confidence and precision, in addition on the value of the proportion in the population.
It’s funny how mathematicians have ways of saying things so that only they can understand them (lame, one-eyed… the bartender, you will tell me, hearing this complaint from a doctor).
For example, I was mulling over the concepts of ratio and proportion, which are similar at times but are different things. And then I came up with the great idea of looking up the mathematical definitions, in the naive hope of clarifying myself quickly and easily.
As it turns out, for mathematicians, a proportion is the equality of two ratios. Of course, so we can finish understand it quite clear, they tell us that a proportion has four components or terms, called extremes (the first and the last) and means (the second and the third). Isn’t that clear?
Let’s see if knowing what a reason is, we enlighten ourselves a little. According to the wise Wikipedia, a ratio is a binary relationship between magnitudes that, in the case of being numerical, can be expressed as a fraction and, eventually, as a decimal. Take that!
It seems that both ratio and proportion are made up of a two-digit quotient. What is particular about proportion is that it implies a relationship of correspondence between the whole and the parts of that whole. Simply put, the numerator of a proportion is included in the denominator.
For example, suppose that in a population of 80 people there are 4 of them who suffer from that horrible disease that is fildulastrosis. We will say that the proportion of patients will be 4 divided by 80 (this 80 includes the 4 patients) or, what is the same, 0.05. We can also multiply it by 100 and say that it is 5%.
This proportion implies a probabilistic concept: it will tell us the probability that, if we choose an individual at random, they have the disease. And that proportion, when we refer to the number of people in a group who suffer from a disease or risk factor at a specific time, is what we call prevalence.
Estimation of a prevalence
Suppose we want to know the proportion of people in our city who suffer from fildulastrosis. In other words, we want to know the prevalence of fildulastrosis in our city.
The most accurate would be to ask one by one about the state of health or disease, but this can pose a problem. Suppose we live in Mexico City, with its more than 8 million inhabitants. Asking everyone was going to make us a bit tiresome.
What is usually done is to select a sample of individuals that is representative of the target population (city dwellers) and measure the prevalence in the more accessible sample.
Once we have the sample value, we will make our estimate of the value that the prevalence will have in the inaccessible population, always with a certain degree of variability or error, which we can also determine.
And what is the sample size necessary to estimate a proportion? The answer to this question depends on a number of factors that we will discuss below.
Factors influencing the sample size for estimating a proportion
To calculate the sample size for estimating a proportion, we must first establish the level of confidence and precision that we want our estimate of prevalence to have. Furthermore, the required sample size will vary according to the value of this prevalence.
The confidence level
Simply put, but not entirely accurate, the confidence level refers to the probability that the confidence interval of our estimate includes the true population value that we cannot measure directly.
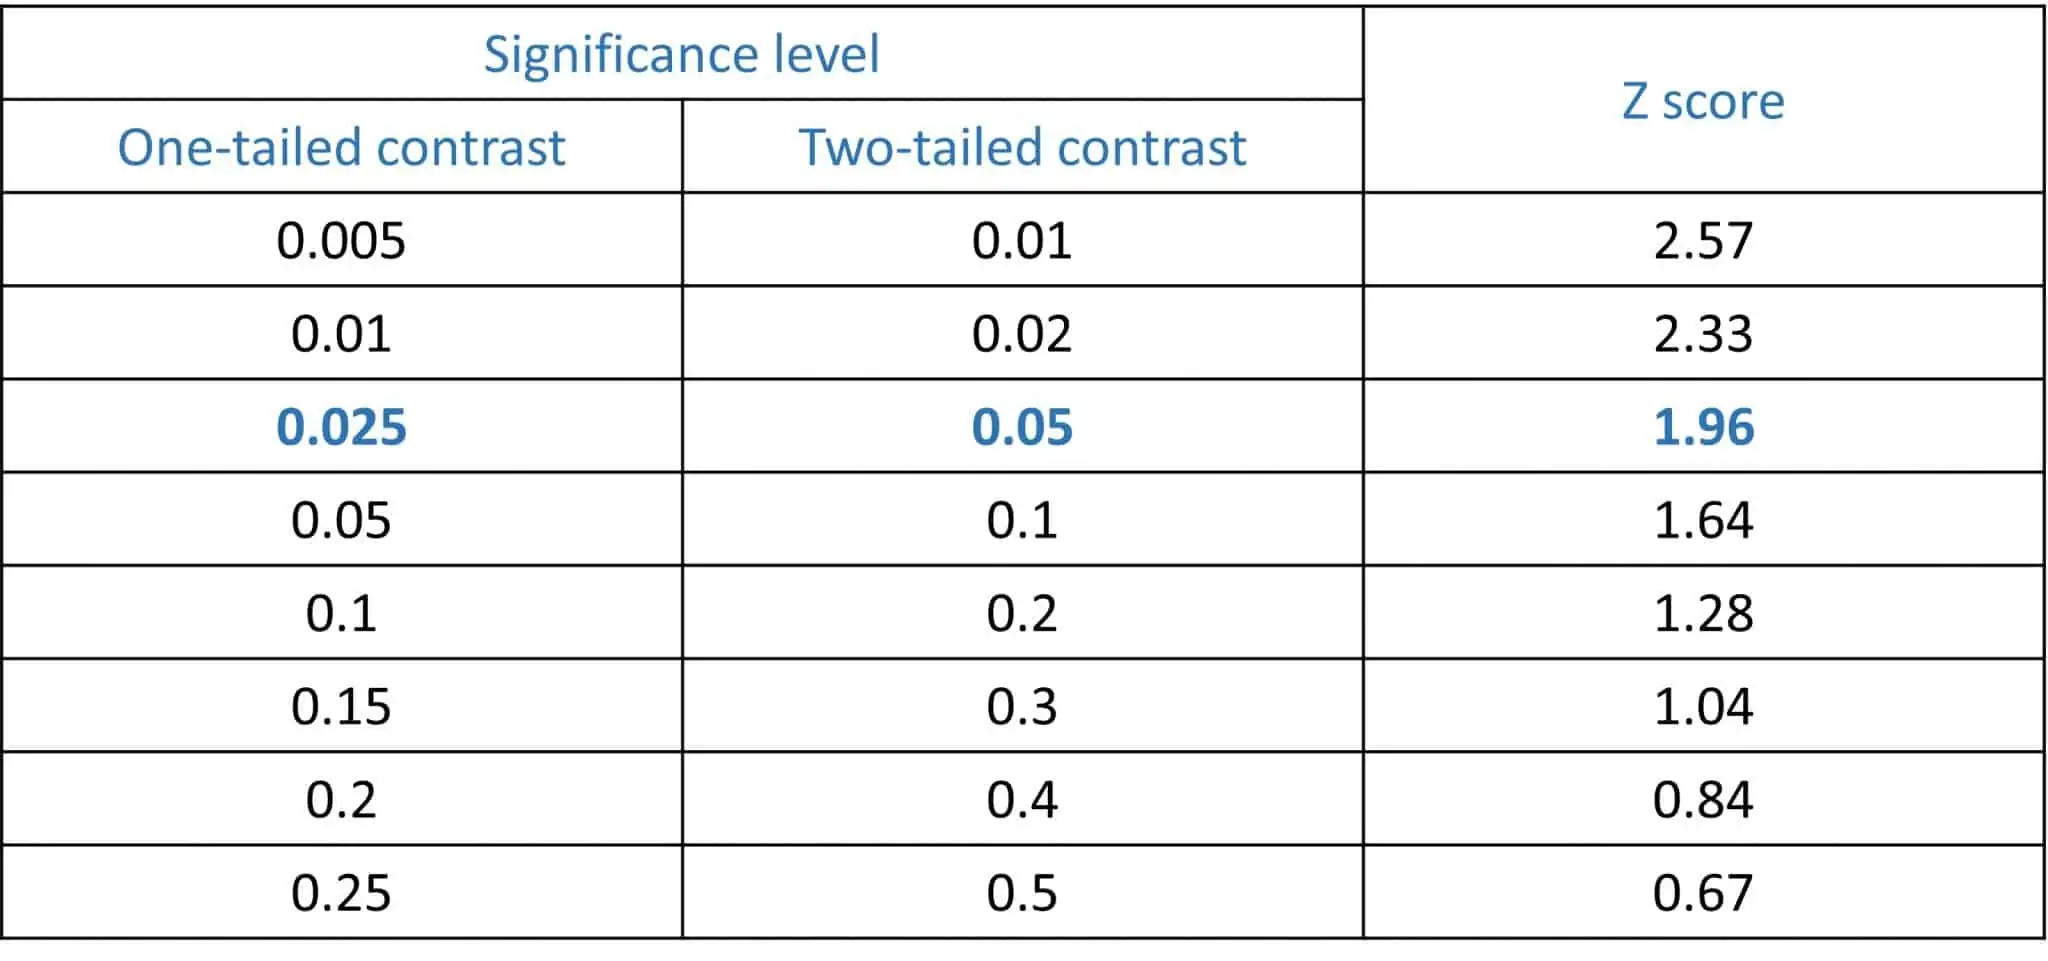
The usual thing is to choose a 95% confidence, with which we will estimate a point value with its 95% confidence interval. This is done using the standardized score that leaves 5% of the standard normal population out of range. This value is what is known as Zα, where α is the significance level (the complement of the confidence level).
Thus, if we choose a 95% confidence, α will be worth 0.05 and a Z of 1.96 will correspond to it for a bilateral contrast. In the attached table I show you some of the most used Z values, although they can be calculated using a normal distribution.
Remember that this choice is made simply by agreement and that, according to each individual case, we can choose the level of confidence we want. Of course, it must be taken into account that the sample size increases directly proportionally to the square of the Zα value: the higher the confidence level, the lower the α value and the higher Zα, with which the sample size will increase.
The precision of the estimate
As always, the precision will be reflected by the width of the confidence interval of the estimate.
Logically, we want to make an estimate as precise as possible, but it must be taken into account that the sample size increases inversely as the square of the width of the interval. This means that the smaller the interval, the larger the sample size.
In addition, by varying with the square of the precision, small increases in the precision of the estimation can lead to a large increase in the sample required for this.
The value of the proportion that we want to estimate
Many of you may be thinking that this condition is a bit absurd: if we knew the value of the proportion, we would not need to make any estimation.
But maths are that whimsical. I think we can already look at the formula to calculate the sample size for estimating a proportion, so I show it to you in the attached figure.
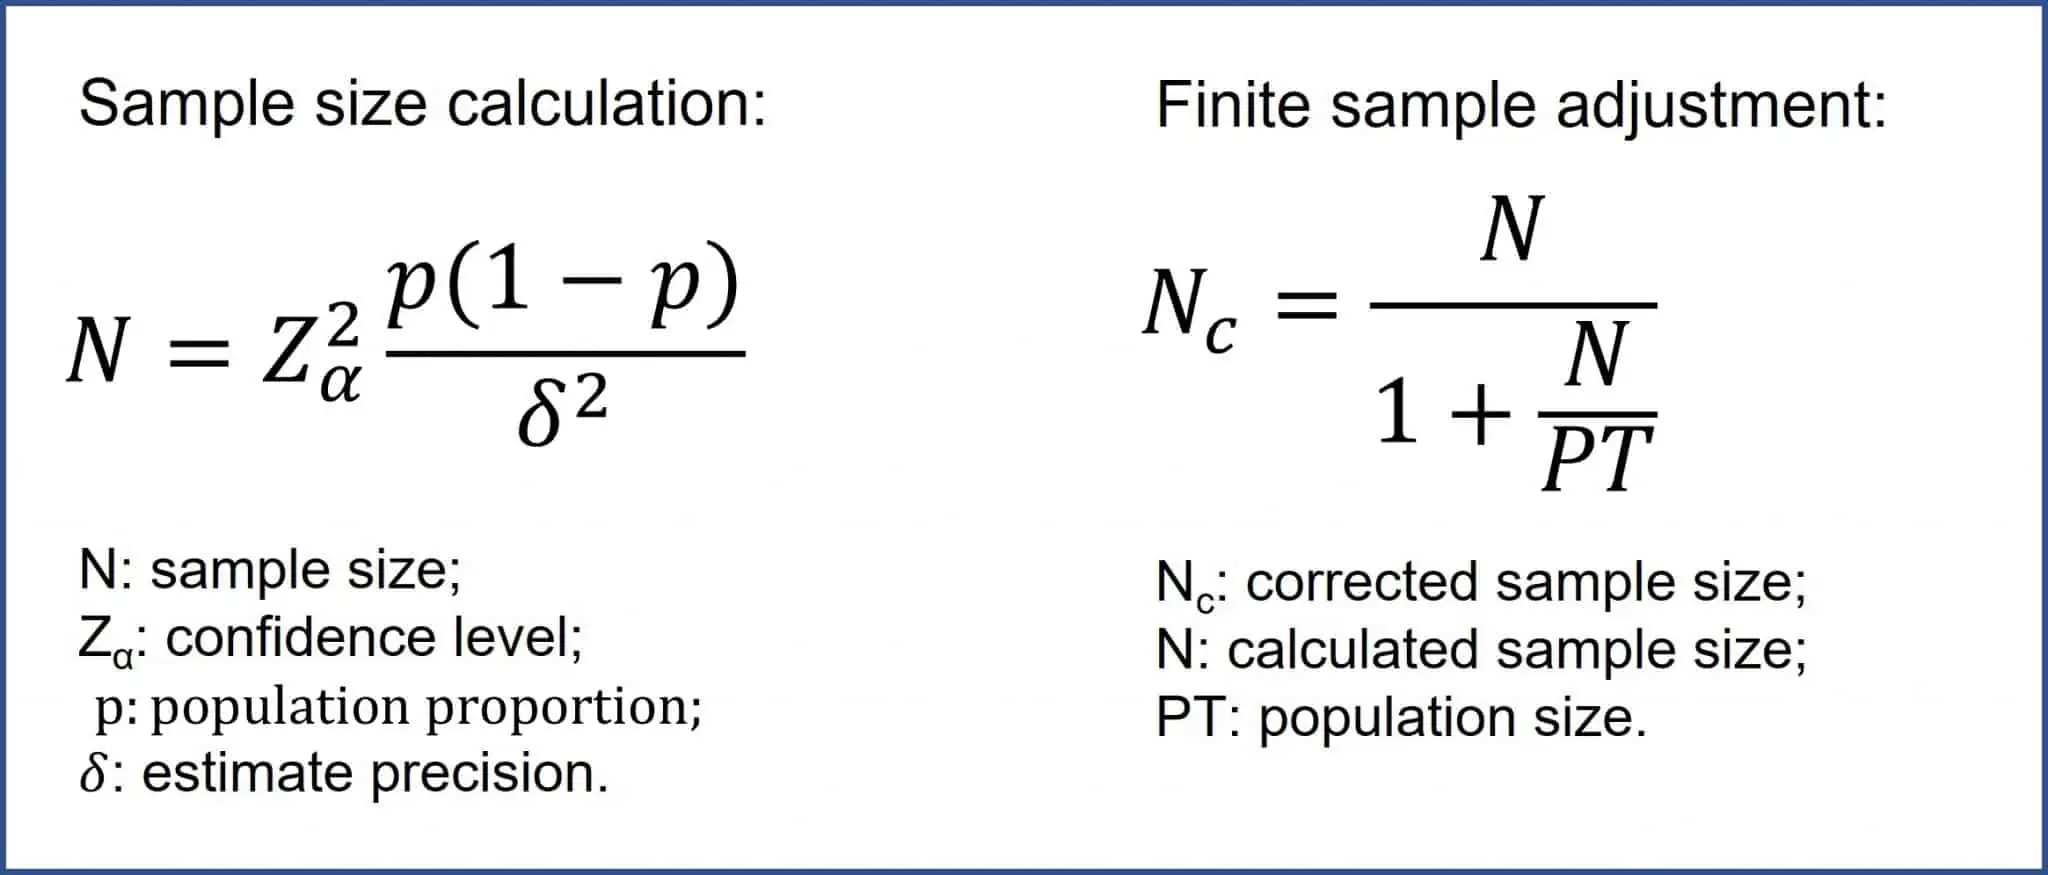
With p being the proportion of patients (prevalence) and 1-p the proportion of healthy people in the population, the necessary sample size increases directly proportionally with the product of p(1-p). We need the prevalence value, even if it is approximate.
This value can be obtained from previous studies of our population or similar ones. In the event that we cannot imagine what the value of this proportion may be, which will be between 0 and 1, we will go to the middle, to 0.5. And this is not a whim, as we will see below.
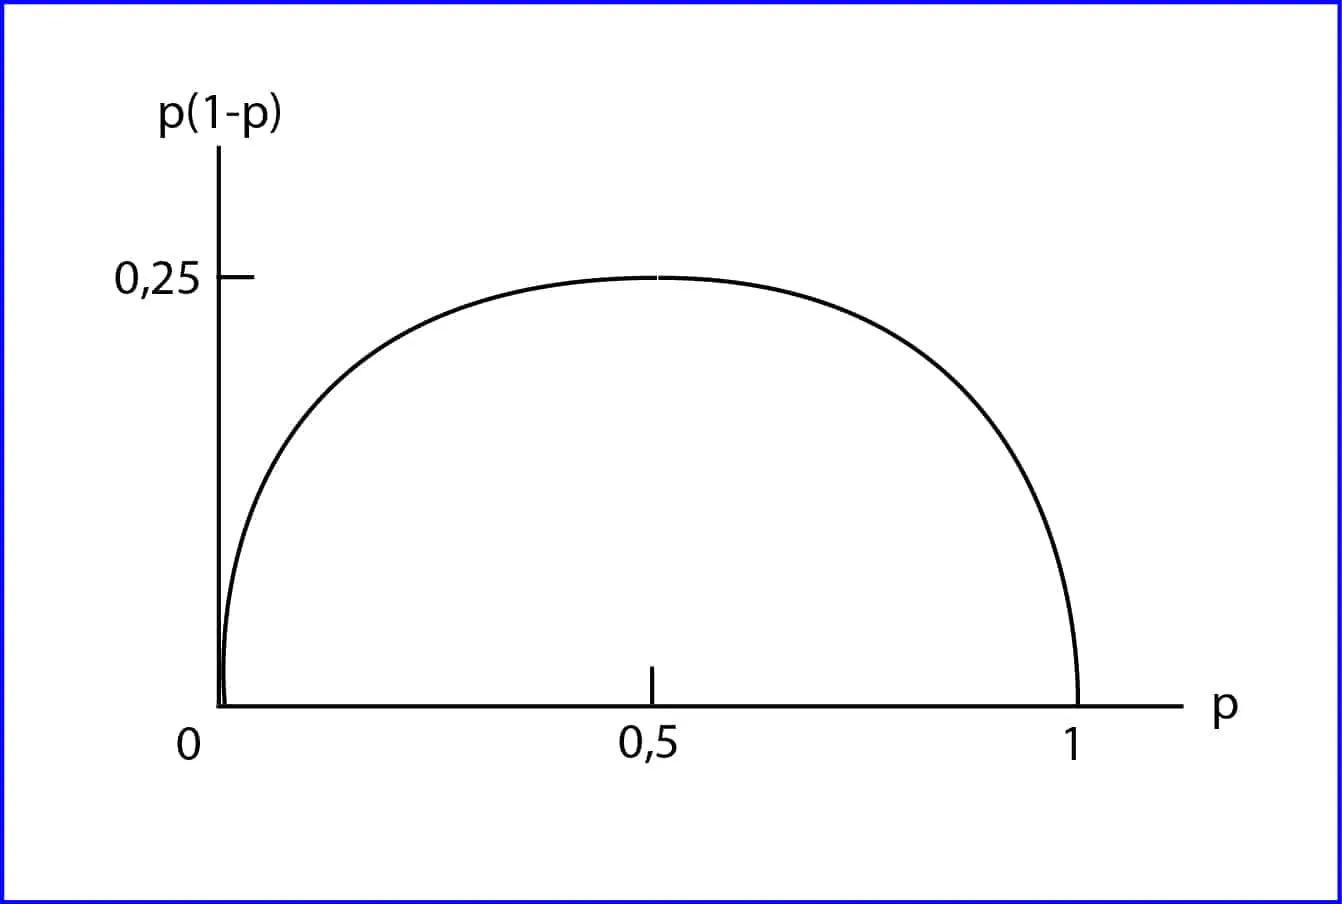
In the attached figure you can see the relation of p to p(1-p) represented. As you can see, the maximum value of this product is reached when p is equal to 0.5. This means that, for the same level of confidence and precision, the necessary sample size will be maximum when the population proportion is 0.5.
Between 0 and 0.5, the sample size will increase, to later decrease as it evolves from 0.5 to 1. Therefore, if you doubt, better to the middle. You will never be short on sample size, although you will probably use more than necessary.
A little correction
So far we have moved on the assumption of a target population large enough to be considered as infinite.
In practice, we can assume that the population is finite when it has less than 5000 elements. In these cases, once the sample size has been calculated according to the formula that I have already showed you, the correction indicated in the same figure will have to be made.
If we do not do this, it may happen that the necessary sample size that we obtain is larger than the target population, so it is better to correct for a finite population and reduce the necessary sample size.
Let’s see some examples
We are going back with our dreaded fildulastrosis. We have read some articles that say that the prevalence in countries similar to ours is 10%. Now we want to estimate the prevalence in our population, with a confidence level of 95% and a confidence interval of ± 5%.
Well, we know that p = 0.1, Zα = 1.96 and d = 0.05.
If we substitute the values in the formula, as shown in the figure, we will see that the necessary sample is 138 people.
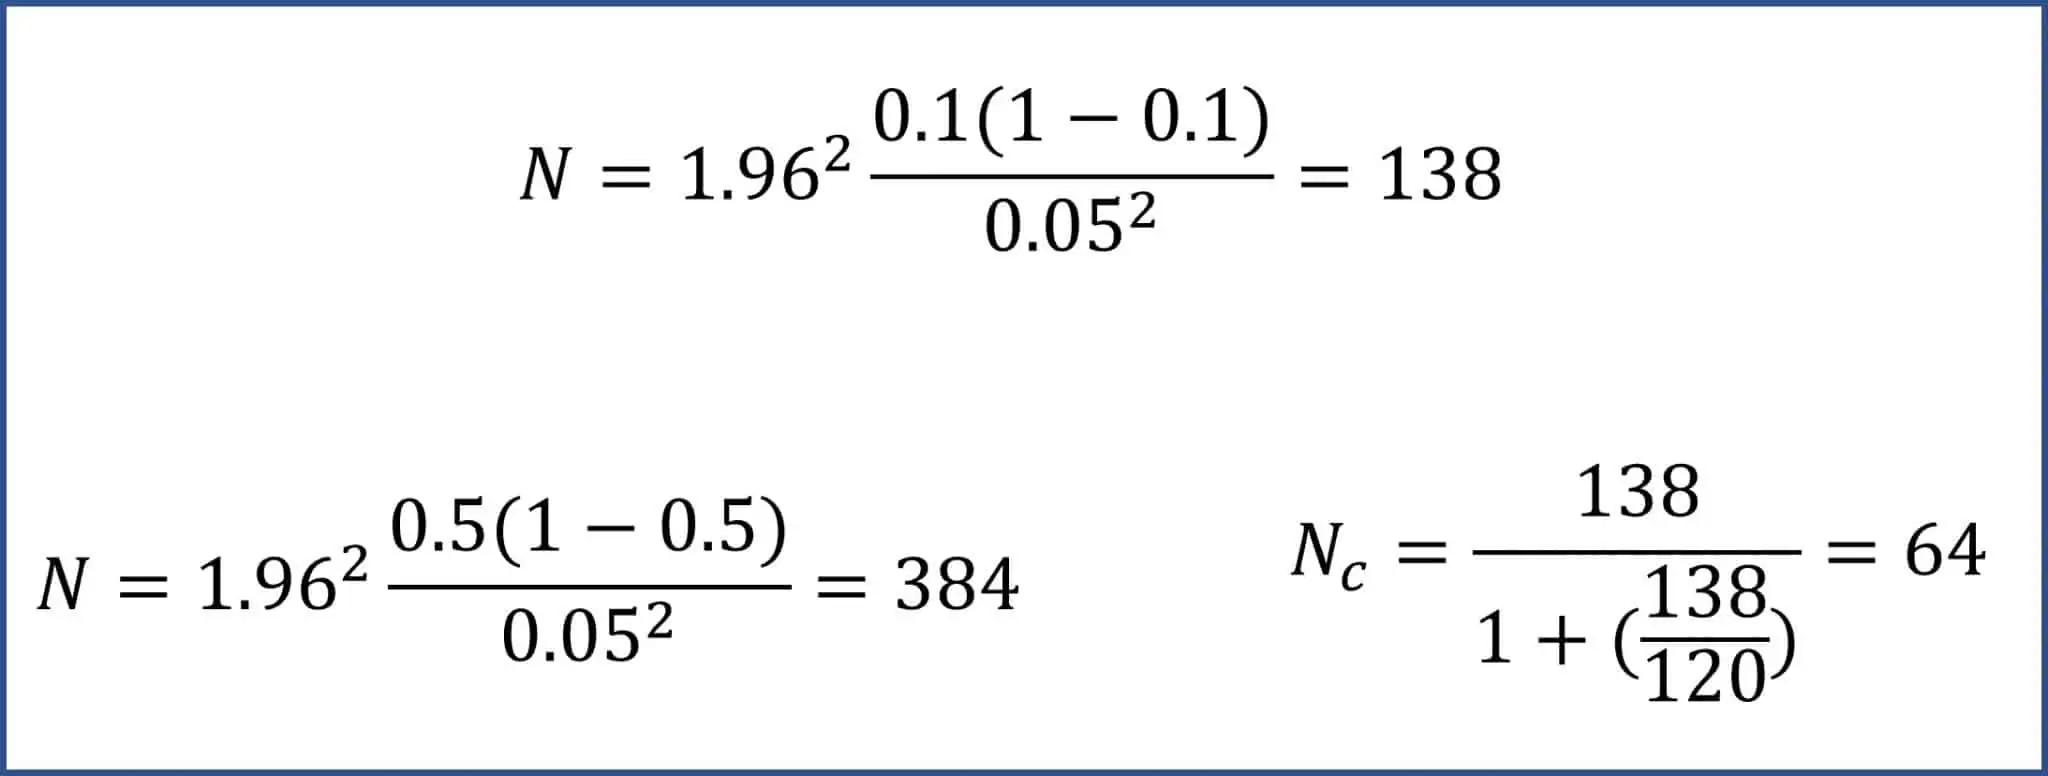
Let us assume that we are totally unaware of the probable prevalence of disease. In this case, we will assume it is 50%. The values of d and Zα do not change, but p is now 0.5. If we substitute in the formula, we will see that we need 384 people, more than on the previous occasion.
Finally, let’s suppose that we want to know the prevalence in a group of 120 people and we don’t want to ask everyone if they are sick or healthy. We would proceed as in the first case, obtaining a sample size of 138, more than we have.
We carry out the correction for a finite sample according to the formula that we already know and obtain a corrected sample size of 64 people.
We’re leaving…
We have seen in this post how to calculate the sample size for estimating a proportion.
We have also seen that the sample size for the same estimate can vary depending on whether it is an infinite or finite, smaller, target population. This is so because we can make fairly accurate estimates with an affordable sample size, but to be able to do so, one condition has to be met: the sample must be representative of the population from which it came. But that is another story…