Se describen las principales medidas de centralización, como la media aritmética, la mediana y la moda.
…where is the medium?. This question, which looks like a summer’s night delirium, must not be so easy to answer given that you have several ways to locate the middle or center of a data distribution.
The matter is that finding the virtuous medium help us to describe our results. If we measure a variable in a series of 1500 patients, it doesn’t go to anybody’s mid to present the results as a list of the 1500 obtained values. We usually look for a sort of summary that gives us an idea of how this variable is distributed in our sample, usually calculating a measure of location (middle) and another of scattering (how data locate around the middle).
Location measures
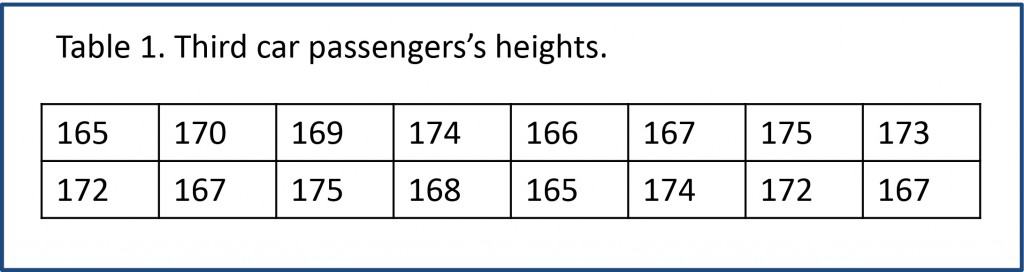
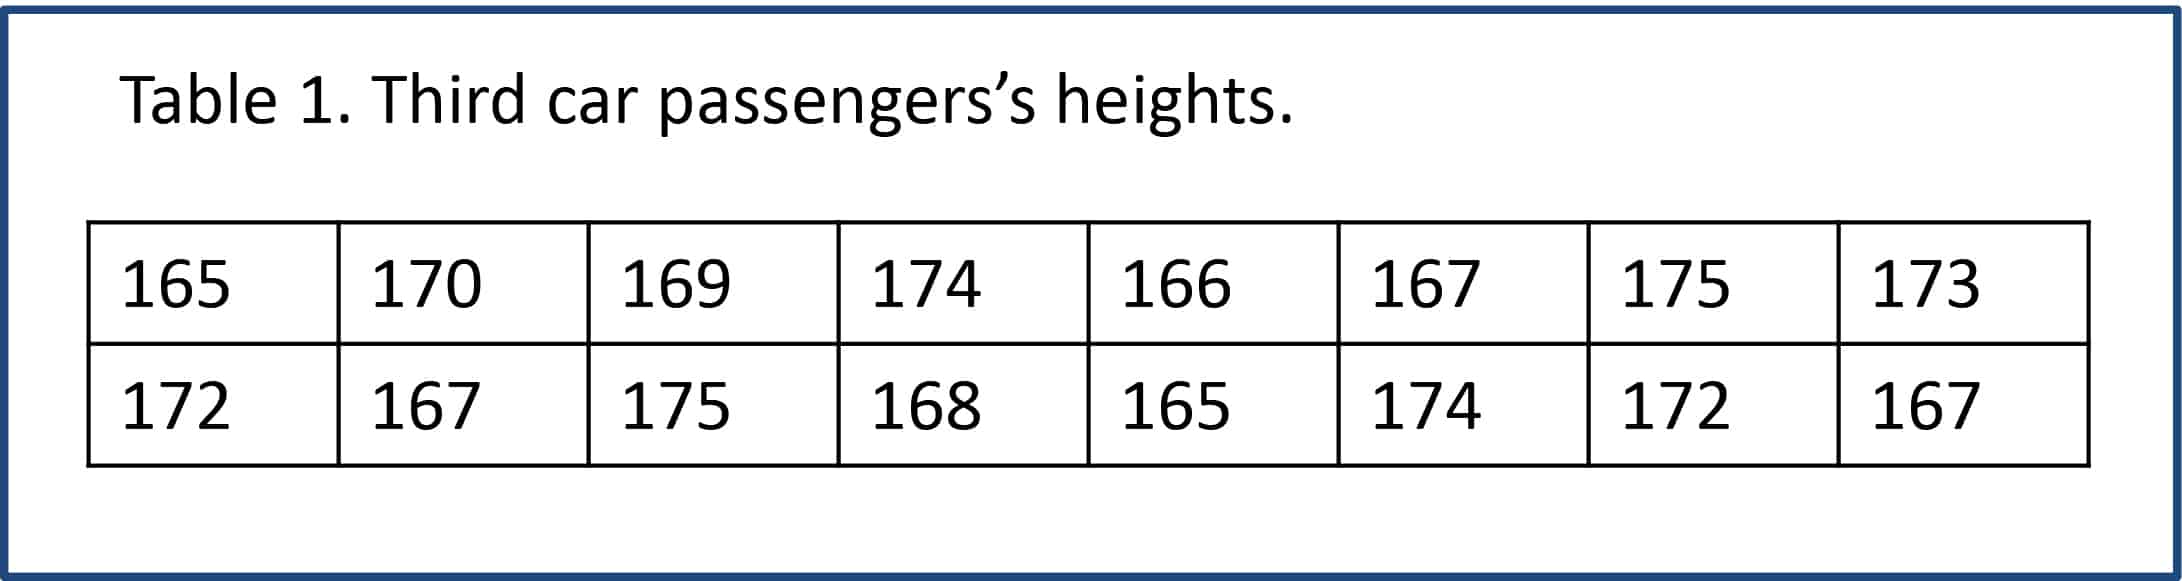
Let’s suppose that, for some reason difficult to explain, we want to know the average height of the Madrid’s Metro users. We go to the nearest station and, when the train arrives, we get on the third car and measure all the passengers’ height, so obtaining the results depicted in Table 1.
Arithmeticc mean
Once we have collected the data, the parameter of data centralization that comes first to our mind is the arithmetic mean, which is the average height. We all know how it’s calculated: the sum of all values divided by the number of values obtained. In our case that value would be 170 cm and gives us and idea of the average height of the members of our sample.
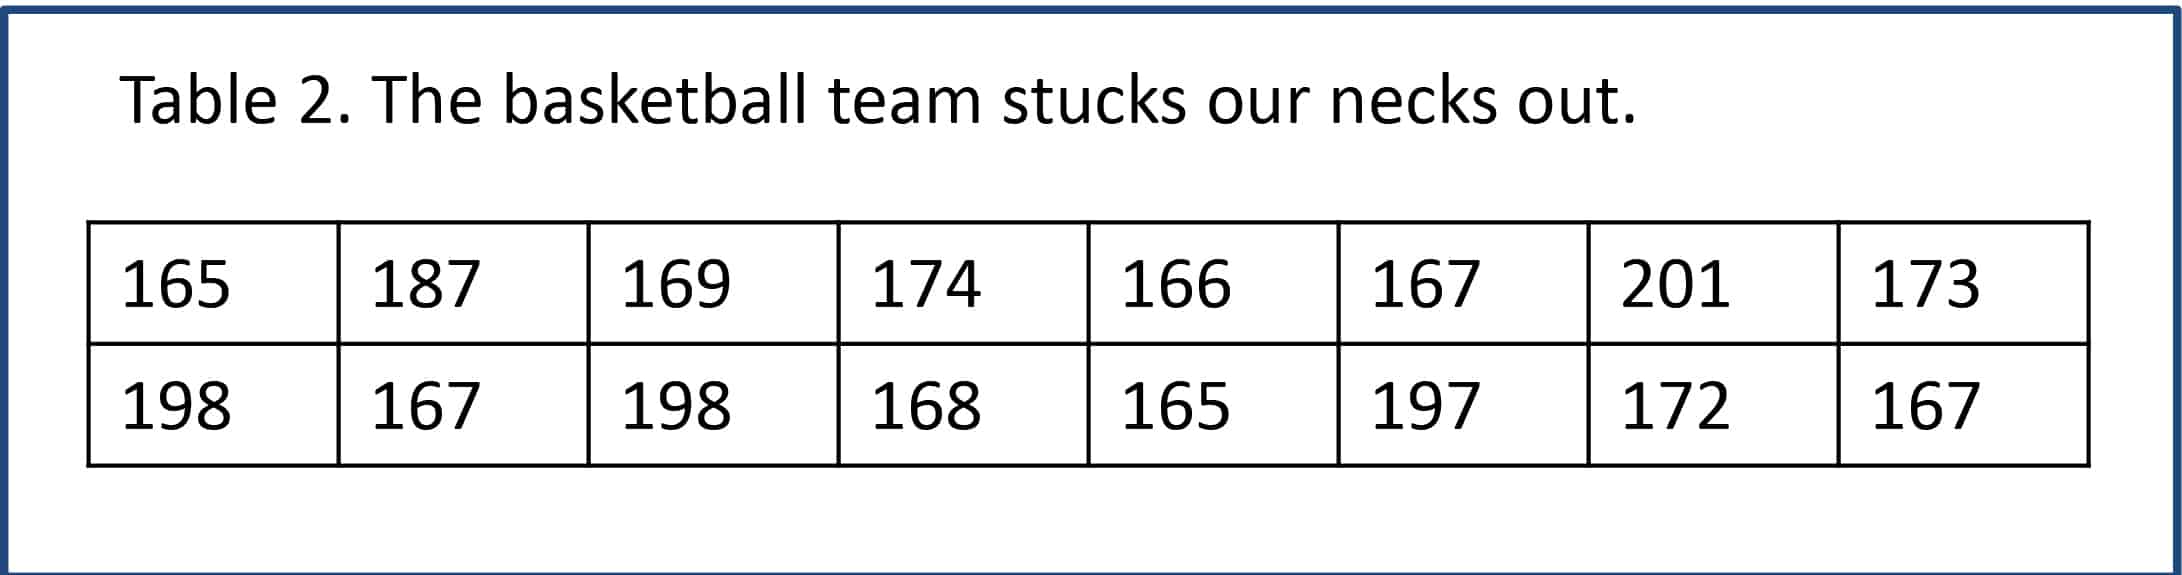
But let’s suppose now that the national basketball team’s bus has all fours of its tires flat and so the players have had to take the subway to go to the game, with the misfortune for us that they travel in the third car. The heights we would come up with are shown in Table 2. In this case the average is 177 cm but, do you really think that value is very close to the average value of most Metro users?. Probably not. In this situation, we would draw upon another measure of location: the median.
Median
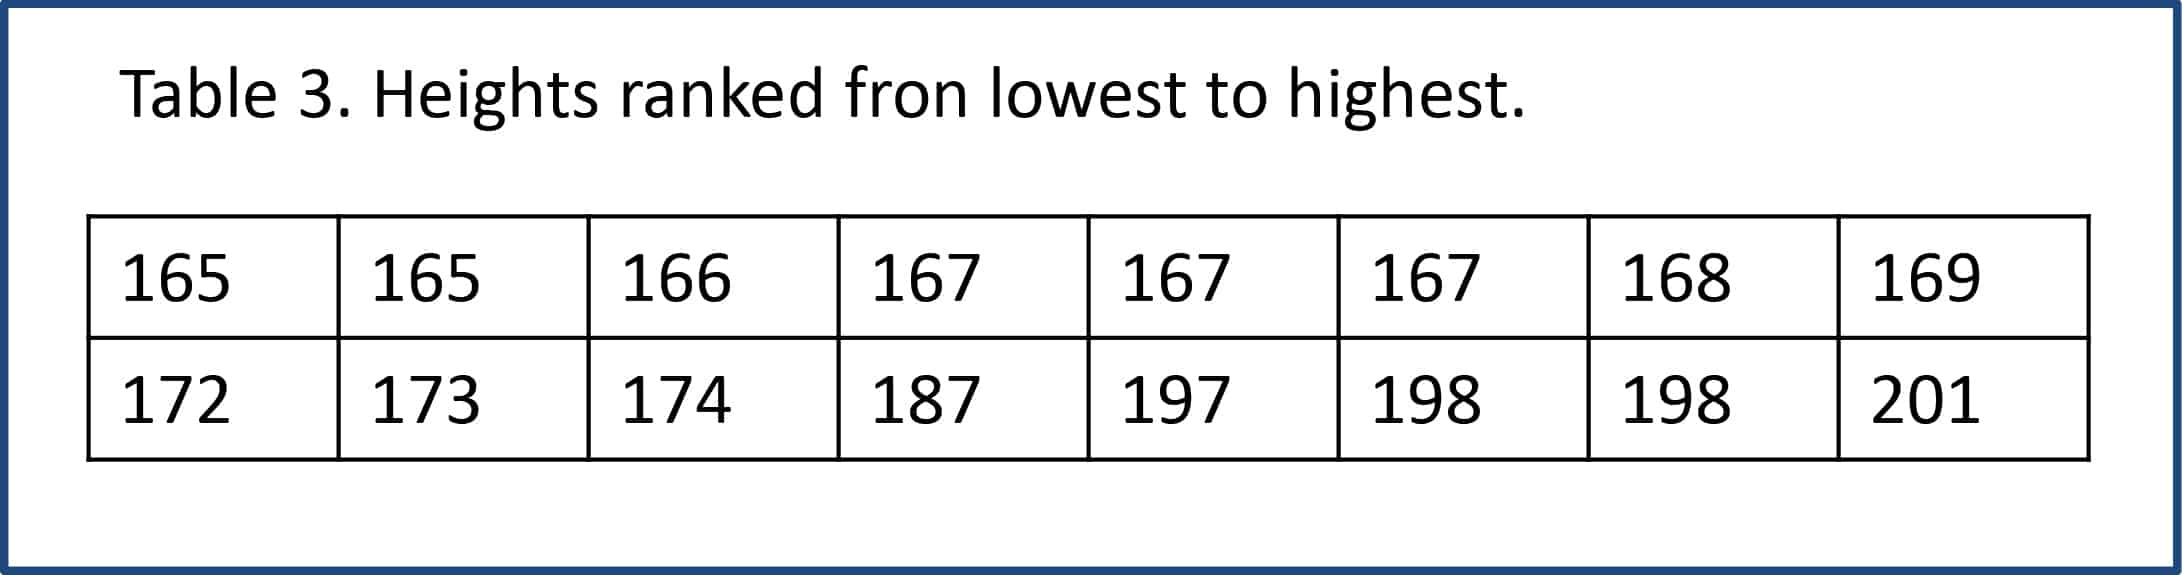
To calculate the median we have to rank the values from lowest to highest and select the one that occupies the middle of the list (Table 3).
If we had 17 measures, the median would be the value at eighth position (leaves seven above and seven below). Being an even number of values, the median is calculated as the arithmetic mean of the two central values. In our case 169 + 172 = 170.5cm, in all probability quite closer to the population’s value and very close to the car we dealt with at the first example.
Thus we see that mean summarizes the data correctly when they are distributed symmetrically, but if the distribution is skewed the median will give us a better idea about the center of the distribution.
Geometric mean and harmonic mean
If the distribution is highly skewed we can employ another two parameters which are relatives to the arithmetic mean: geometric mean and harmonic mean.
To get the geometric mean we have to calculate the natural logarithm of all values, calculate its mean and do the inverse transformation based on e exponential (the number e).
To get the harmonic mean we calculate the reciprocal values (1/value), calculate the arithmetic mean and do the inverse transformation (do not panic for the math involved, statistical programs calculate this kind of stuff almost without we have to ask then for it). These two means are very useful when the distribution is much skewed and most of the values are around a certain number with a long tail to the right or left. For example, if we set up a roadside breath control at six o’clock on
Monday morning, most of the drives will be very close to zero, but there will always be some higher determinations (those who have slept late and those who prefer a strong breakfast). In these cases, any of the two medians would be more representative than the arithmetic mean or the median.
Mode
One final note on another measure of location. Imagine that we look at our subway travelers’ pants and see that 12 of them wear jeans. What parameter would we use to know what is their preferred garment?. In this case, the mode. It’s the most frequently occurring value in a distribution and can be very useful when you are describing qualitative rather than quantitative variables.
We’re leaving…
Anyway, let’s do not forget that to adequately summarize a distribution we have to choose not only a measure of location. It must be completed by a measure of dispersion, of which there’re a few at our disposal. But that’s another story…
Esta web utiliza cookies propias y de terceros para su correcto funcionamiento y para fines analíticos. Al hacer clic en el botón Aceptar, aceptas el uso de estas tecnologías y el procesamiento de tus datos para estos propósitos. Antes de aceptar puedes ver Configurar cookies para realizar un consentimiento selectivo.
Más información


[…] already know that the arithmetic mean is the most famous of the measures of central tendency of a distribution, so it should come as no […]