
Publication bias in meta-analysis.

Publication bias, characteristic of meta-analyzes, is described. Some of the methods to assess the existence of the risk of bias are shown.
We can find strength through unity. It is a fact. Great goals are achieved more easily with the joining of the effort of many. And this is also true in statistics.
In fact, there are times when clinical trials do not have the power to demonstrate what they are pursuing, either because of lack of sample due to time, money or difficulty recruiting participants, or because of other methodological limitations. In these cases, it is possible to resort to a technique that allows us sometimes to combine the effort of multiple trials in order to reach the conclusion that we would not reach with any of the trials separately. This technique is meta-analysis.
The origin of the problem
Meta-analysis gives us an exact quantitative mathematical synthesis of the studies included in the analysis, generally the studies retrieved during a systematic review. Logically, if we include all the studies that have been done on a topic (or, at least, all that are relevant to our research), that synthesis will reflect the current knowledge on the subject. However, if the collection is biased and we lack studies, the result will reflect only the articles collected, not the total available knowledge.
When planning the review we must establish a global search structure to try to find all the articles. If we do not do this we can make a recovery bias, which will have the same effect on the quantitative analysis as the publication bias has. But even with modern electronic searches, it is very difficult to find all the relevant information on a particular topic.
In cases of missing studies, the importance of the effect will depend on how the studies are lost. If they are lost at random, everything will be in a problem of less information, so the accuracy of our results will be less and the confidence intervals will be broader, but our conclusions may be correct. However, if the articles that we do not find are systematically different from those we find, the result of our analysis may be biased, since our conclusions can only be applied to that sample of papers, which will be a biased sample.
The why os publication bias in meta-analysis
There are a number of factors that may contribute to the publication bias. First, the studies with meaningful results are more likely to be published and, within these, they are more likely to be published when the effect is greater. This means that studies with negative results or with effects of small magnitude may not be published, so we will draw a biased conclusion from the analysis of only large studies with a positive result.
Secondly, of course, published studies are more likely to come into our hands than those that are not published in scientific journals. This is the case of doctoral theses, communications to congresses, reports from government agencies or even studies pending to be published by researchers of the subject we are dealing with. For this reason it is so important to do a search that includes this type of work, which fall within the term of gray literature.
Finally, a number of biases can be listed that influence the likelihood that a paper will be published or retrieved by the investigator performing the systematic review such as language bias (we limit the search by language), availability bias (to include only those studies that are easy to retrieve by the researcher), cost bias (to include studies that are free or cheap), familiarity bias (only those of the discipline of the investigator), duplication bias (those who have significant outcomes are more likely to be published more than once) and citation bias (studies with significant outcome are more likely to be cited by other authors).
One may think that losing studies during the review cannot be so serious, since it could be argued that unpublished studies in peer-reviewed journals are often of poorer quality, so they do not deserve to be included in the meta-analysis. However, it is not clear that the scientific journals ensure the methodological quality of the study or that this is the only method to do so. There are researchers, such as government agencies, who are not interested in publishing in scientific journals, but in producing reports for those who commission them. In addition, peer review is not a quality assurance because, too often, neither the researcher who performs the study nor those in charge of reviewing it have a methodology training that ensures the quality of the final product.
Assessment of risk of publication bias
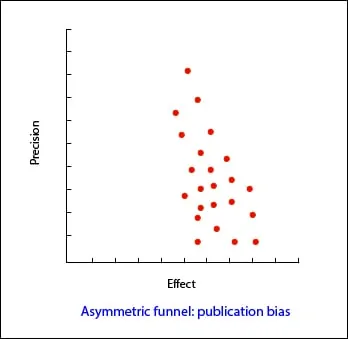
There are tools to assess the risk of publication bias. Perhaps the simplest may be to represent a forest plot ordered with the most accurate studies at the top and the less at the bottom. As we move down the precision of the results decreases, so that the effect must oscillate to both sides of the summary measure result. If it only oscillates towards one of the sides, we can indirectly assume that we have not detected the works that must exist that oscillate towards the opposite side, reason why surely we will have a bias of publication.
And, at this point, what should we do in the face of a publication bias? Perhaps the most appropriate thing is not to ask if there is bias, but how much it affects my results (and assume that we have left studies without being included in the analysis).
The only way to know if publication bias affects our estimates would be to compare the effect on recovered and unrecovered studies, but of course, then we would not have to worry about publication bias.
Fail-safe N methods
In order to know if the observed result is robust or, conversely, it is susceptible to be biased by a publication bias, two methods have been devised called as the fail-safe N methods.
The first method is the Rosenthal’s fail-safe N method. Suppose we have a meta-analysis with an effect that is statistically significant, for instance, a relative risk greater than one with a p <0.05 (or a 95% confidence interval that does not include the null value, one). Then we ask ourselves a question: how many studies with RR = 1 (null value) will have to be included until p is not significant? If we need few studies (less than 10) to invalidate the value of the effect, we may be concerned that the effect may actually be null and our significance is the result of a publication bias. Conversely, if many studies are needed, the effect is likely to be truly significant. This number of studies is what the letter N of the method name means.
The problem with this method is that it focuses on statistical significance rather than on the relevance of results. The correct thing would be to look for how many studies are necessary so that the result loses clinical relevance, not statistical significance. In addition, it assumes that the effects of missing studies are zero (one in the case of relative risks and odds ratios, zero in cases of mean differences), when the effect of missing studies may go the other way than the effect we detected or In the same direction but of smaller magnitude.
To avoid these drawbacks there is a variation of the previous formula which values statistical significance and clinical significance. With this method, which is called the Orwin´s fail-safe N, we calculate how many studies are needed to bring the value of the effect to a specific value, which will generally be the smallest effect that is clinically important. This method also allows specifying the average effect of missing studies.
We’re leaving…
And here we leave the meta-analysis and publication bias for today. We have not talked about any other mathematical methods to detect publication bias like Begg’s and Egger’s. There is even some graphic method apart from the ones we have mentioned, such as the trim and fill method. But that is another story…