
Robust location parameters.

We describe robust location parameters that are more robust to the presence of extreme values than arithmetic mean.
The mean is a whimsical statistic. Of course, I am referring to the arithmetic mean. And why do I say that it is whimsical?. Because its taste for going following outliers.
The arithmetic mean (from now on simply the mean) is the most used measure of central tendency. And a measure of central tendency is one that informs us about what the center of the distribution is.
Arithmetic mean varies with outliers
Suppose we measure serum cholesterol values and found the following ones (in mg/dl): 166, 143, 154, 168, 435, 159, 185, 155, 167, 152, 152, 168, 177, 171, 183 , 426, 163, 170, 152, and 155.
We can check that most of the values (16 to be exact) are between 150 and 180 mg/dl. Let’s calculate the mean to see if it correctly reports the center of the distribution.
As you know, to calculate the mean we have to add all observations and divide the result by the total number of observations. For those of you who like formulas, it’d be the following:
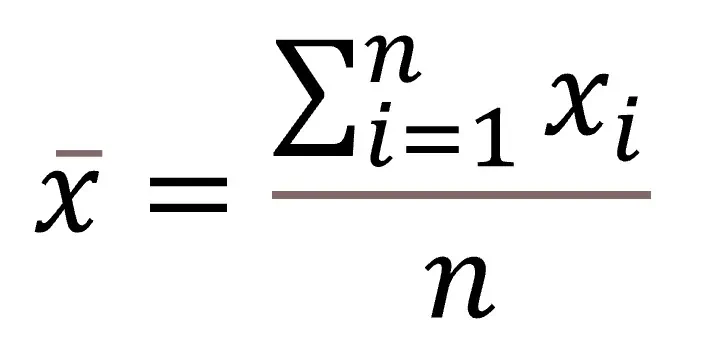
If you do it, you will see that the mean is 190. This value is outside the range that includes 80% of the items. How can it be?. Easy, you may have seen it by now. It turns out that in the sample we have included two siblings with familial hypercholesterolemia and they have some very high values of cholesterol, which act as outliers in the distribution. And this is where the tendency of the media to leave the central point and leave behind outliers comes. As outliers are towards the right, the mean shifts right and loses its characteristic, to represent the midpoint of the distribution.
Robust location parameters
In these cases, if we want to determine the parameter that best represents the center of the distribution, we have to resort to robust measures. This term has nothing to do with the physical force we need to calculate them, but refers to statistics that are not influenced (or are little affected) by small changes in the sample or by extreme values.
In this sense, the arithmetic mean is not very robust. Notice that if we simply remove the two extreme values, it changes from 190 to 163, a much more representative value of the center of the distribution.
There are a number of robust measures of central tendency. The best known is the median. To calculate it, the first thing we have to do is to sort the values from lowest to highest: 143, 152, 152, 152, 154, 155, 155, 159, 163, 166, 167, 168, 168, 170, 171, 177, 183, 185, 426, and 435. As there’re 20 values, the median value is the average of those in the tenth and eleventh positions (166 and 167), that is, 166.5. You see, closer to the center without removing the outliers.
In addition to the median, there’re a number of relatives of the arithmetic mean belonging to the family of robust central tendency measures.
One of them is the geometric mean, which is calculated multiplying all the values and finding the n-exponent root of the result (n is the number of observations). For the lovers of formulas, here goes:
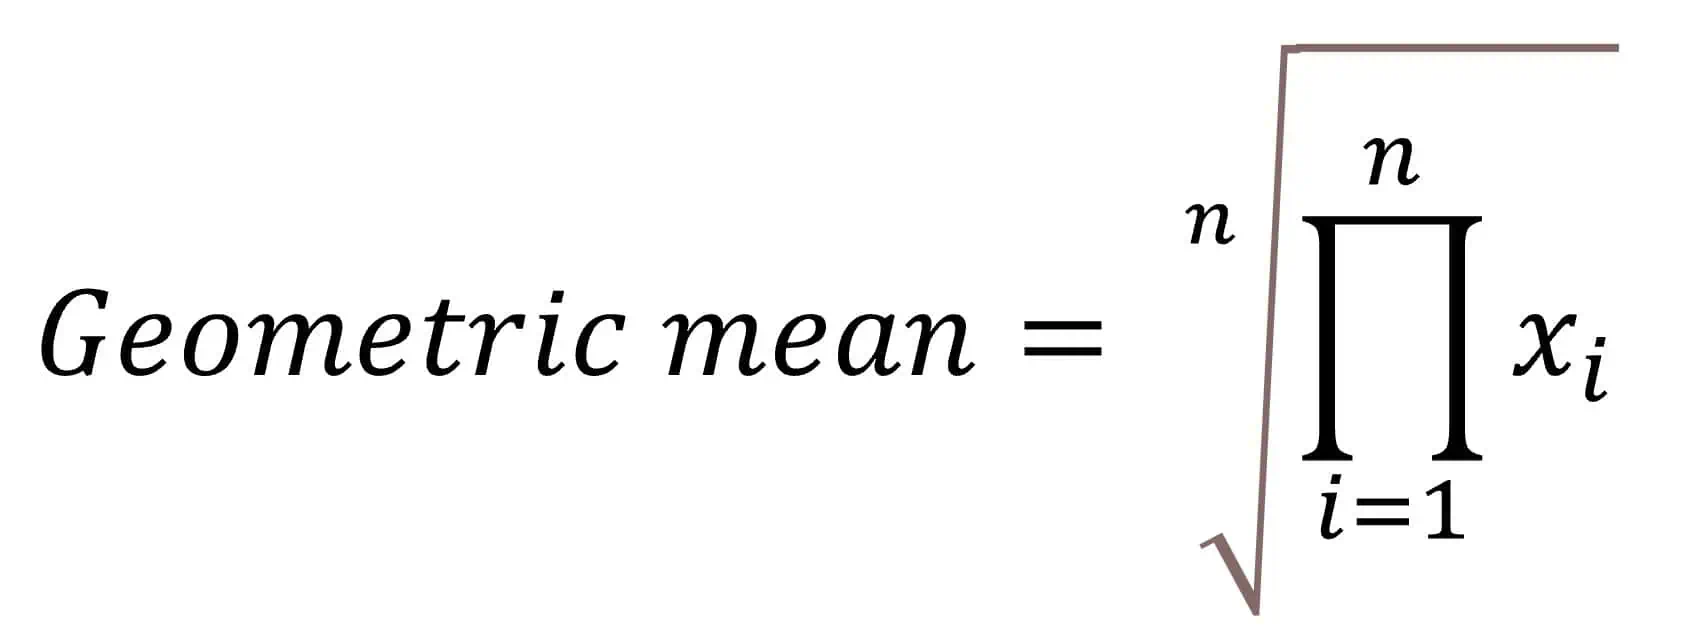
In our case we would multiply 143x152x152x…x426x435 and we’d do the 20th root of the product. The result is 179.57. The calculation is a bit cumbersome, so I used the R program to calculate it. There is another way to reach the same value that consists in finding the natural logarithms of the values, calculate their arithmetic mean and finally make the antilog of the mean. In any case, any statistical program can calculate the geometric mean unblinking. This mean is rarely used, although we can see it sometimes in papers on Microbiology, because some of the parameters used, such as the titles of the dilutions, follow a logarithmic scale.
For those who think the geometric mean is a piece of cake I have prepared the harmonic mean. This is calculated dividing the number of observations by the sum of the inverse of each value. Perhaps it would be better to understand if I show you the formula:
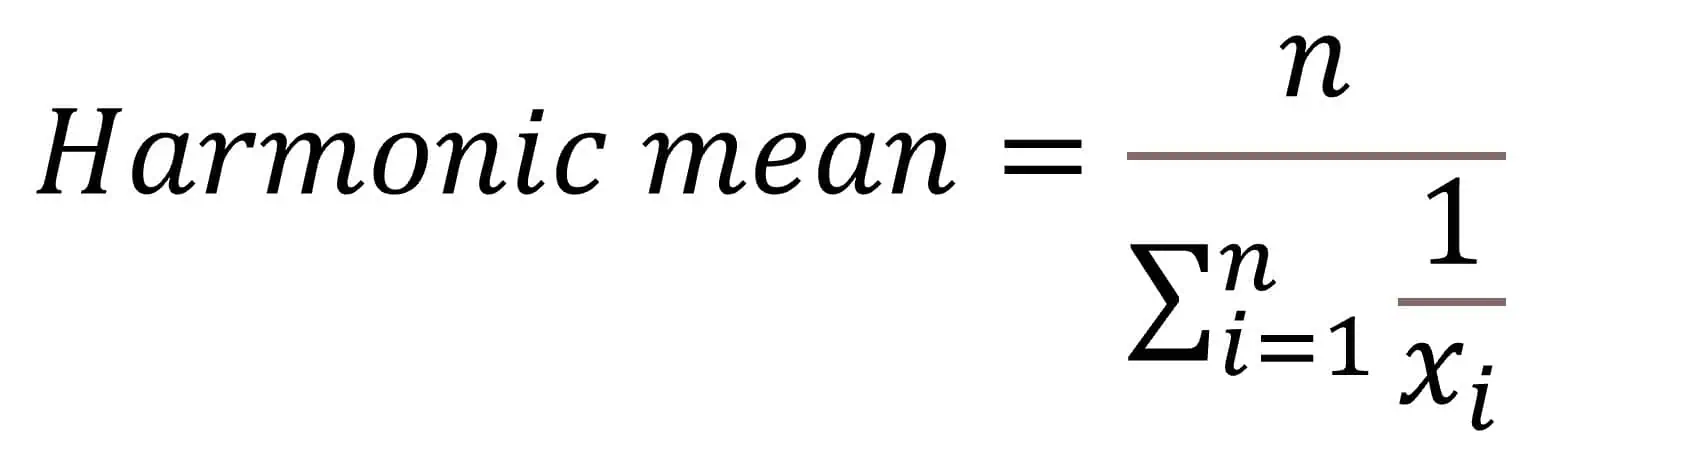
Making use of R one more time, its value is 173.36, similar to the previous value. This mean is not used very often, but we can find it sometimes, especially in papers on Pharmacology.
Much easier to calculate is the trimmed mean. This, as the name suggests, is calculated by cutting a certain percentage of the distribution at their ends (the distribution has to be ordered from lowest to highest). For example, to calculate the 20% trimmed mean in our example, we’d remove 10% of data per side (two elements per side: 143, 152, 426, and 435) and calculate the arithmetic mean with the remaining. Its value is 165.31.
A variation of the latter is the winsorized mean. Instead of eliminating the values, we replace the extreme values with those close to them. In our case, 143 and 152 would be replaced by 152, and 426 and 435 by 185. Its value is 165.95.
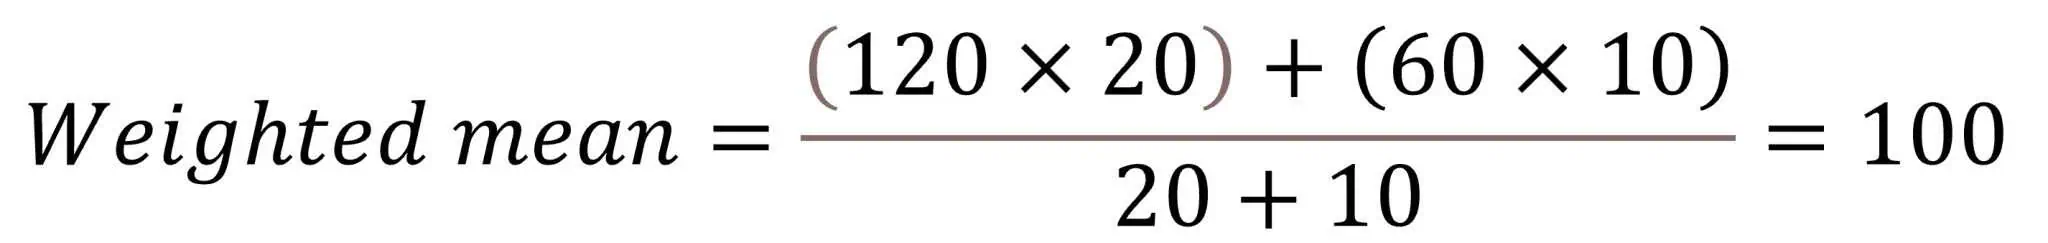
Perhaps the most frequently used member of this robust family, apart from the mean, is the weighted mean. A certain weight (w) is assigned to each element and then, to calculate the weighted mean, we add the product of each element times its weight and divide the result by the sum of weights. The formula is:
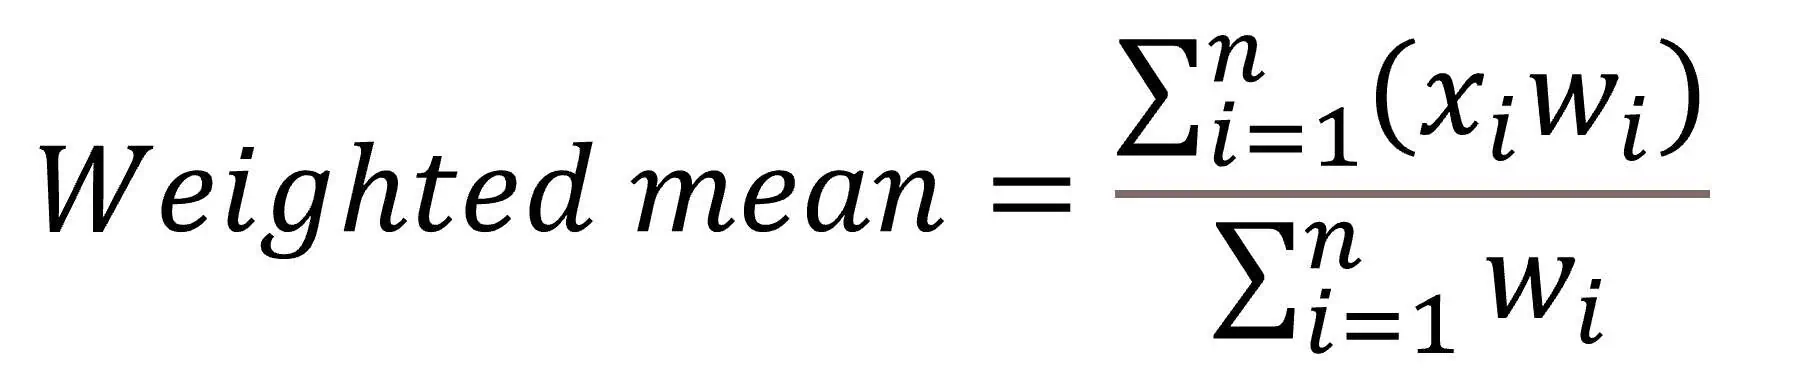
Let’s calculated an invented weighted mean with blood pressure values in which the weight for systolic is 20 and for diastolic 10. If the values for systolic and diastolic are 120 and 60, respectively, the weighted mean would be
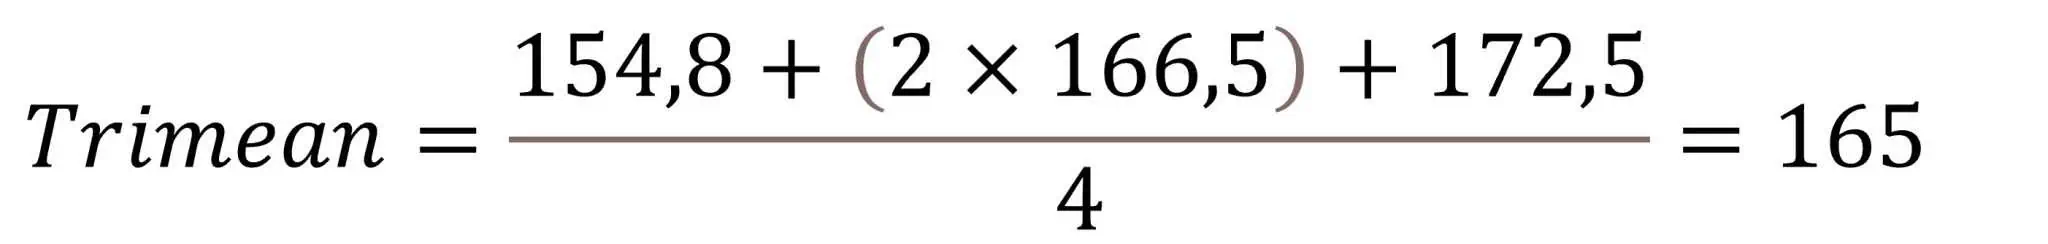
A variation of the weighted mean is one known as trimean. It’s calculated as the arithmetic mean of the three quartiles (first, median and third), weighting the median by two and the first and third quartiles by one (the sum is divided by four). In our example, cholesterol’s first quartile value is 154.8, the median is 166.5, and the third quartile 172.5, so the trimean is equal to
We’re leaving…
And here we are going to stop for today. You have seen that the robust relatives of the arithmetic mean are a great family. But do not think we’ve talked about all the members of this family. There are many others whose statistics computation is rather unfriendly, but we can calculate with most software packages. They are, for example, the R and M trend estimators, such as Huber’s, the Tukey’s biweigth estimator, the Hampel´s redescendent, the Andrew’s estimator, etc, etc. But that’s another story…