
Student’s t distribution.

Something similar to what happens with chocolate happens to me with beer: I like all types of them, absolutely all, except those with fruit, especially if they are cherries. I recognize that fruit is a healthy and recommended food, but I prefer everything in its place and not confuse wheat with chaff.
We already talked about chocolate one day, so today we will talk about beer. Or rather, an illustrious person from the world of beer, who lived between the nineteenth and twentieth centuries, none other than William Sealy Gosset.
Don’t you know who he was? Wait a bit and you will see.
A bit of history
What surely you all know is Guinness beer, that toasted beer, I would say rather black, with such a characteristic flavor and with a foam so white and dense that it helped to create the legend, otherwise false, that it had coffee as part of its composition.
William Sealy Gosset worked at Guinness in the early 1900s and applied his knowledge of statistics to quality control and to improve both the malt grown on the farm and the beer made at the brewery.
The problem that Gosset had is that he worked with small samples, so he was subject to errors in his estimates, especially when he had extreme values in his samples.
So, with the help of a friend of his, a certain Pearson, whose name I hope will tell you something, he drew up a new probability distribution, the well-known Student’s t distribution, which we are going to talk about today.
Student’s t distribution
Nowadays, the Student’s t distribution is one of the most used in statistical inference associated with small samples, so it is the one that is usually used to contrast a sample mean with the mean of a population and for the comparison of two means.
It is quite similar to a standard normal distribution, although, while the normal is defined by its mean and its variance, the Student’s t distribution also incorporates its degrees of freedom, which is why it is usually referred to as tn, where n the number of degrees of freedom, usually calculated as n-1 (n is the sample size).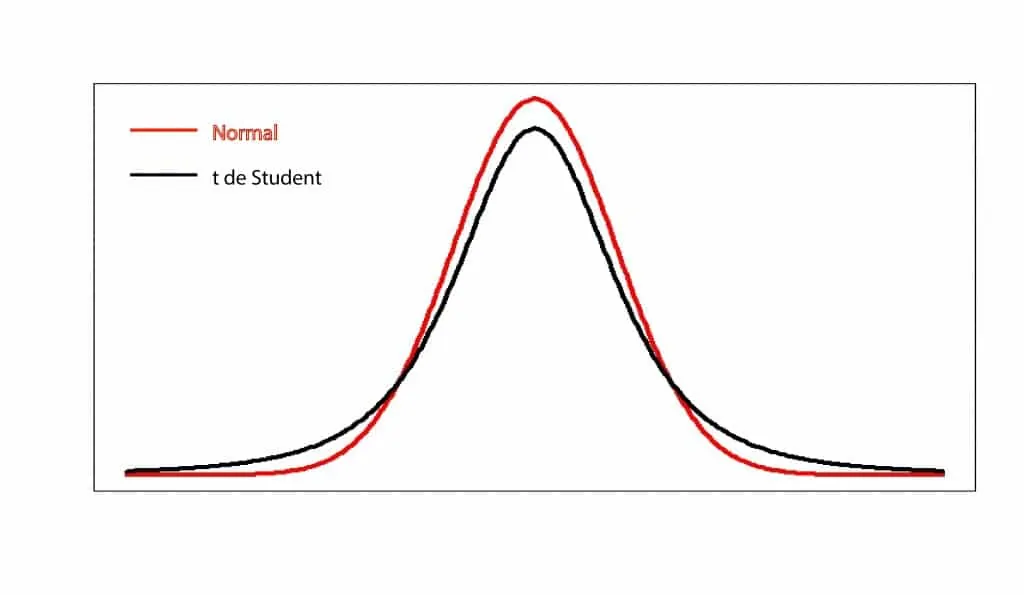
Its shape, as we have said, is similar to that of the normal distribution, centered on zero, bell-shaped and symmetric, although the Student’s t has heavier tails than the Gaussian curve. This implies a greater dispersion of the data, which means that the estimates are less precise and the confidence intervals are wider than those that would be obtained by applying the normal distribution.
In any case, these differences disappear as the size of the sample increases. When n is large, an approximation can be made with a normal distribution with a minimum degree of error. This is so because the characteristics of the tails depend on the degrees of freedom of the distribution, being lighter as the number of degrees of freedom increases and, therefore, the sample size.
In summary, and to put it in a more technical way, as the sample size (and the degrees of freedom) decreases, the cumulative probability in the tails increases, and vice versa. A Student’s t distribution with 30 or more degrees of freedom is practically indistinguishable from a normal distribution with the same mean and variance.
The utility of the Student’s t distribution
As we have already said, Pearson helped Gosset to tabulate the distribution and, to round off the task, he published it in his magazine, which was called Biometrika. But Pearson, clever as he was, did not realize the significance of Gosset’s find.
Luckily, Gosset had many friends (had it something to do with working in a brewery?) And another of them did know how revolutionary the method was. He was no other than the great Ronald Fisher, whom we have also talked about in a previous post.
Indeed, it was Fisher who introduced the concept of degrees of freedom, which are so important for this distribution, since they allow adjusting the effect of the deviation of the estimates produced by the small sample size, although, of course, paying the price of obtain a lower precision, especially with the smallest samples.
This is what makes it possible to use the Student’s t distribution to estimate the value of the population mean of a random variable that follows a normal distribution when the parameter is drawn from a small sample and the population variance is unknown.
Furthermore, as we have already mentioned, it is used in the contrast of hypotheses between two means when the random variable follows a normal distribution and there is equality of variances (homoscedasticity) between the two groups that are contrasted.
A bit more of history before finishing
At this point, those of you who do not know the story of Gosset’s adventures will be wondering why we call it Student’s t and not Gosset’s t.
On this matter, as was the case with Apple’s bitten apple, there are two versions.
The most widespread version claims that Guinness had prohibited its employees from publishing articles of any kind. This was because a previous employee had published secrets of the brewery, which he wanted, with this prohibition, to prevent the leak of more confidential information. That is why Gosset published his work in Biometrika under the pseudonym of Student.
But I prefer another versión that is less known but much prettier. A modern and progressive company like Guinness understood the need to apply statistical knowledge to improve its production, but did not want the competition to do something similar and thus lose this advantage. That is why Gosset would have published his work under a pseudonym, so as not to link him to the brewery.
We’re leaving…
And with this we are going to finish for today.
We have seen how a restless and intelligent spirit (with the help of some friends) knew how to adapt statistics to his needs in order to improve his estimates without being limited by the small sample size that he had to use in his studies.
But the objective was not only this; he also sought that production was not subject to variations in environmental conditions of soil, climate and things like that. In other words, he was interested in developing robust methods in the presence of extreme values. Although the credit at this point would later be awarded to his friend Fisher. But that is another story…