Centralization and dispersion.

The measures of centralization and dispersion, arithmetic mean and standard deviation, as well as the calculation of kurtosis are described.
Numbers are a very peculiar creatures. It seems incredible sometimes what can be achieved by operating with some of them. You can even get other different numbers expressing different things. This is the case of the process by which we can take the values of a distribution and, from their arithmetic mean (a measure of centralization) calculate how apart from it the rest of the variables are and to raise the differences to successive powers to get measures of dispersion and even of symmetry. I know it seems impossible, but I swear it’s true. I’ve just read it in a pretty big book. I’ll tell you how…
Centralizatuon and dispersión
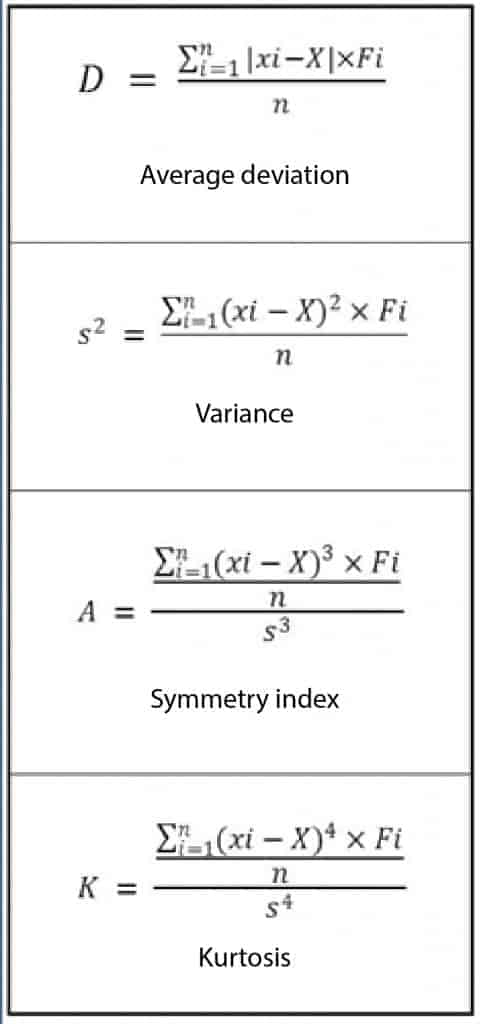
Once we know what the arithmetic mean is, we can calculate the average separation of each value from it. We subtract the mean from each value and divide it by the total number of values (like calculating the arithmetic mean of the deviations of each value from the mean of the distribution).
But there is one problem: as the mean is always in the middle (hence its name), the differences with the highest values (to be positive) will cancel out with that of the lowest values (which will be negative) and the result will always be zero. It is logical, and it is an intrinsic property of the mean, which is far from all the values the same average quantity. Since we cannot change the nature of the mean, what we can do is to calculate the absolute value of each difference before adding them. And so we calculate the mean deviation, which is the average of the deviations absolute values with respect to the arithmetic mean.
Standard deviation
And here begins the game of powers. If we add the square differences instead of adding its absolute values we’ll come up with the variance, which is the average of the square deviations from the mean. We know that if we square-root the variance (recovering the original units of the variable) we get the standard deviation, which is the queen of the measures of dispersion.
And what if we raised the differences to the third power instead of square them?. Then we’ll get the average of the cube of the deviations of the values from the mean. If you think about it, you’ll realize that raising them to the cube we will not get rid of the negative signs. Thus, if there’s a predominance of lower values (the distribution is skewed to the left) the result will be negative and, if there is of higher values, will be positive (the distribution is skewed to the right).
One last detail: to compare the symmetry index with other distributions we can standardize it dividing it by the cube of the standard deviation, according to the formula I write in the accompanying box. The truth is that to see it scares a little, but do not worry, any statistical software can do this and even worse things.
Kurtosis
And as an example of anything worse, what if we raised the differences to the fourth power instead of to the third?. Then we’ll calculate the average of the fourth power of the deviations of the values from the mean. If you think about it for a second, you’ll quickly understand its usefulness. If all the values are very close to the mean, when multiplying by itself four times (raise to the fourth power) the result will be smaller than if the values are far from the mean.
So, if there are many values near the mean (the distribution curve will be more pointed) the value will be lower than if the values are more dispersed. This parameter can be standardize dividing it by the fourth power of the standard deviation to get the kurtosis, which leads me to introduce three strange words more: a very sharp distribution is called leptokurtic, if it has extreme values scattered it’s called platykurtic and if it’s neither one thing nor the other, mesokurtic.
And what if we raise the differences to the fifth power?. Well, I don’t know what would happen. Fortunately, as far as I know, no one has jet thought about such a rudeness.
We’re leaving…
All these calculations of measures of central tendency, dispersion and symmetry may seem the delirium of someone with little work to do, but do not be deceived: they are very important, not only to properly summarize a distribution, but to determine the type of statistical test we use when we want to do a hypothesis contrast. But that’s another story…
