Beta distribution.

The binomial distribution is used when we want to calculate the probability of obtaining a certain number of successes in a series of Bernoulli trials, assuming we already know the probability of success in each trial. In contrast, the beta distribution is used in the opposite situation: we have observed a given number of successes and failures, and we want to estimate how likely each possible value of the success probability is.
A while back, I told you about the mess my cousin got into when he had to throw a party and ended up in charge of dessert. Even though he knew a great recipe, the cake only turned out right half the time. So of course, he wanted to figure out how many cakes he needed to bake to make sure he’d have at least one good one ready for the guests.
Well, now I’m the one stuck in that same mess, trying to figure things out so I don’t end up embarrassing myself in front of my guests. My cousin had used some binomial probability thing to figure out that if he baked 5 cakes, he had about a 97% chance that at least one would be edible. Still sounded like a big gamble to me, so I figured I’d play it safe and just hire a pro.
Hiring a chef should’ve been easy enough, so I found one who claimed that 80% of his cakes turn out great. But if you know me, you know I don’t take things at face value. I wanted proof.
So, I gave him the ingredients, brought him into the kitchen, and told him to bake 10 cakes. That’s when the trouble started. Only 6 out of the 10 were any good—just 60%—and the other 4 were complete disasters.
The poor guy tried to explain it away, saying it was just bad luck. Happens to everyone, right? Maybe the oven was off, maybe he misread the recipe, maybe one of the ingredients had gone bad. But there’s also the more uncomfortable explanation: maybe he talked himself up a little too much. Or worse—maybe he straight-up lied.
So how can we tell if he just had an off day, or if his cakes really don’t turn out as great as he claimed? That’s where stats come in. Just like my cousin used binomial probability, we can now use the beta function to get a better idea of this chef’s true success rate.
Keep reading, and we’ll try to figure out whether he’s a fraud or just unlucky. One thing’s for sure—we’ll be putting numbers to the uncertainty.
The binomial approach to the problem
Let’s start with the basics to see how we can figure out if our cook is telling the truth.
If he claims that 80% of his cakes turn out well, that means exactly that: 80% of his cakes come out good, no more, no less. And what about the next cake? The answer is simple—it has an 80% chance of being good and a 20% chance of ending up in the trash. In short, it’s like Schrödinger’s cat: we don’t know if it’s alive or dead until we open the box, or in this case, until we taste the cake.
Putting aside the issue of quantum decoherence, we can safely say that the more cakes he makes, the more likely it is that at least one of them will be good. That way, we can know the probability of having at least one edible cake based on the number of attempts the cook makes. To do that, we apply the formula for calculating binomial probability.
If you’ll allow me, here’s the formula to calculate it:

In this formula, n is the number of cakes baked, x is the number of cakes that come out well, and p is the probability that a given cake turns out good.
This cook boasts an 80% success rate. What is the probability that, by baking 10 cakes, 8 or more of them will turn out well? We can substitute the values into the formula above or, better yet, use a statistical program or calculator to get the result.
I typed the command dbinom(8, size = 10, prob = 0.8) in R, and it told me that the probability of getting exactly 8 good cakes is 30%. But I don’t really care about just exactly 8. Indeed, I’d feel even better if 8 or more of the 10 were good.
To do that, I used the command pbinom(7, size = 10, prob = 0.8, lower.tail = FALSE), which gave a probability value of almost 68%. That is, there’s no guarantee that there will always be 8 or more good cakes out of 10. It will only happen 68% of the times we put the cook to the test by having him bake 10 cakes.
So far, the numbers seem to lean in the cook’s favor. It’s possible that he’s telling the truth and just had a bad day, after all.
But since “possible” is not the same as “probable,” we’d like to know the likelihood that, if he isn’t lying, he’d get such a low success rate. The answer comes from a different probability distribution than the binomial: the beta distribution.
The beta distribution
To get our bearings straight: when we say we expect the cook to get 8 good cakes out of 10, we’re assuming he’s telling the truth and that his overall success rate really is 80%.
But let’s flip the perspective. Could it be that other success rates—different from 80%—also make it likely to get 8 good cakes? That could happen with lower success rates, in which case maybe the cook’s not being entirely honest.
To answer that, we could imagine a bunch of possible scenarios and crunch a ton of binomial calculations for each one. But instead, we’re going to use the beta distribution, which gives us a much simpler and more direct way to look at it.
With the beta distribution, we can estimate how likely different success rates are, given a specific number of successes and failures. To get a bit technical, the beta distribution tells us the probability of each possible success rate, based on a certain number of good and bad outcomes.
Since it’s a probability distribution, the beta distribution gives us a curve between 0 and 1, and the total area under that curve equals 1. To find the probability of a specific range of success rates, we calculate the area under the curve for that range.

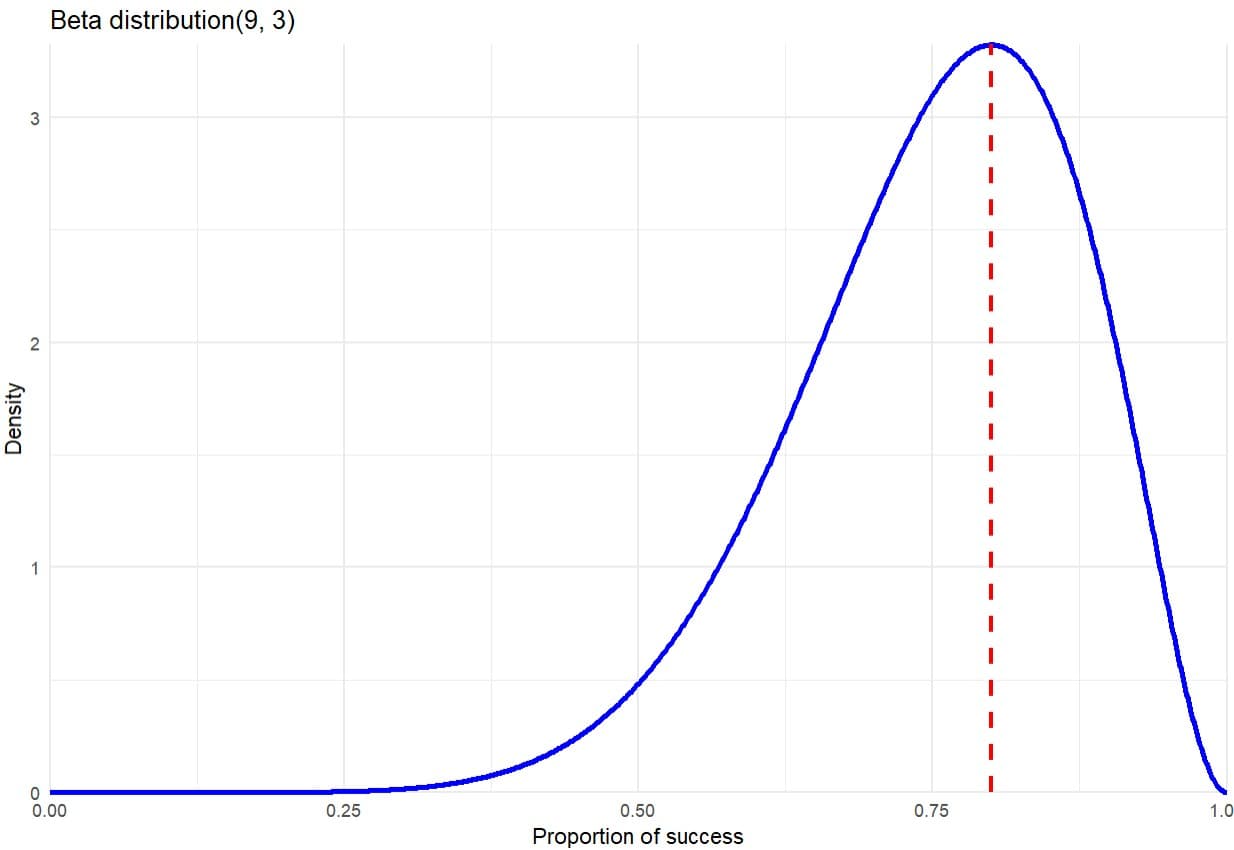
Like most density functions, the beta distribution formula isn’t exactly friendly, so I won’t write it out here, but I can tell you it’s based on two parameters: alpha, which is the number of successes plus one, and beta, which is the number of failures plus one. You can use R’s dbeta() function to calculate and plot the distribution, like in the attached figure.
As you can see, for 8 successes out of 10 attempts, the most likely success rate really is 80%, just like the cook claims. But since this is a continuous function, to calculate actual probabilities, we need to integrate the area under the curve within a certain interval.
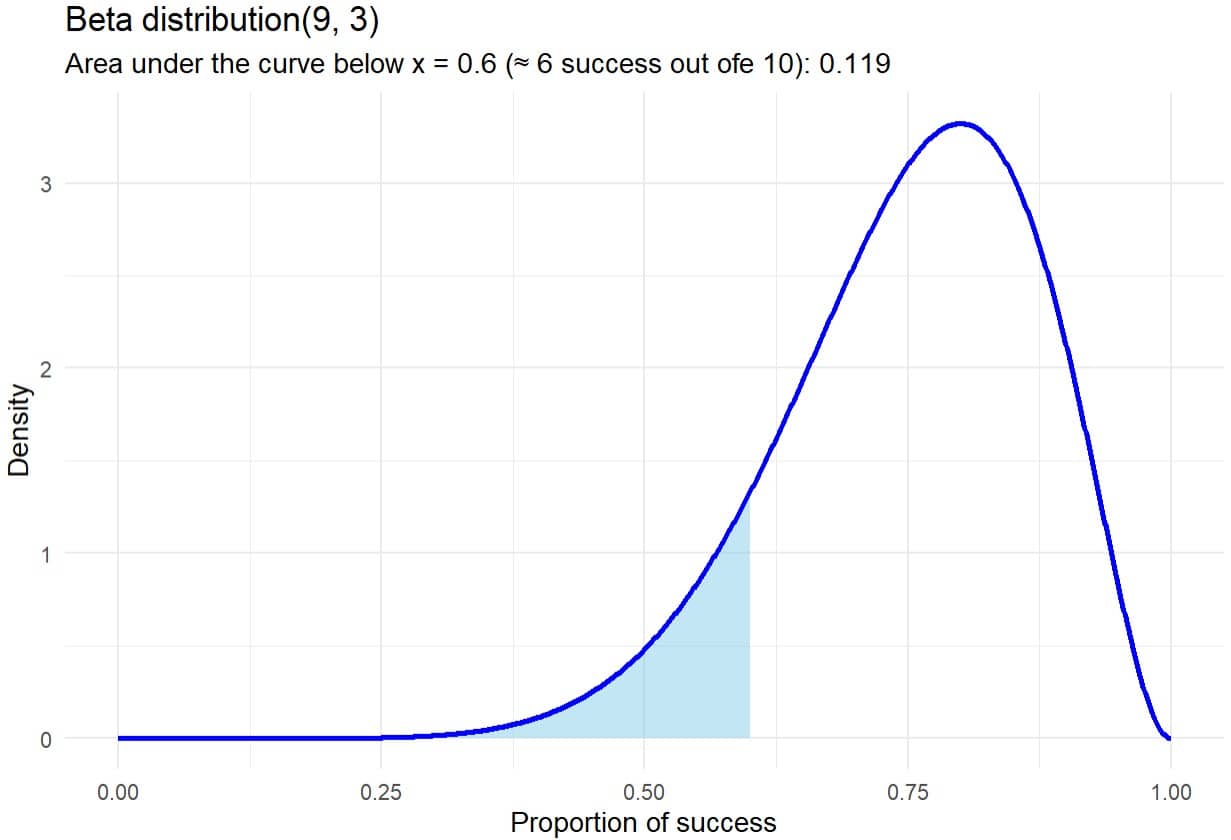
Now, since our cook only got 6 good cakes during our test, we can ask R to calculate the probability of getting 6 or fewer successes if his real success rate were 80%. You can see that shaded area in the second figure.

The blue-shaded region shows the probability that a cook with an 80% success rate ends up with 6 or fewer successes out of 10 cakes. The probability, rounded off, is about 12%. Honestly, that’s pretty low, but not extremely so. It’s still possible he’s telling the truth and just had an off day. To be more confident, we’d need to run more tests or have him bake more cakes each time.
Then again, maybe I should just go for a safer dessert altogether. At this rate, this party is going to cost me a fortune.
We’re leaving…
And so here we are, staring at those 6 decent cakes out of 10, wondering if this chef is a misunderstood genius or just a fraud in an apron.
Thanks to the beta function, we can not only estimate what the chef’s true baking skills might be, but also express that uncertainty in a thoughtful, informed way. Is it likely that his real success rate is 80%? Or is it more like 60%… or even lower?
In the end, we’ll need to run more tests to start getting a clearer picture of what this chef is really capable of. That, in essence, is what Bayesian statistics is all about: updating our beliefs as new data comes in, helping us fine-tune our intuition with a bit more precision. But that’s another story…
