Discontinuity regression.

Discontinuity regression is a quasi-experimental design that allows causal inference to be made in the absence of randomization.
In medicine we often try to look for cause-effect relationships. If we want to show that the drug X produces an effect, we have only to select two groups of people, one group we give the drug, the other group we do not give it and see if there are differences.
But it is not so simple, because we can never be sure that differences in effect between the two groups actually are due to other factors than the treatment we have used. These factors are the so-called confounding factors, which may be known or unknown and which may bias the results of the comparison.
The problem of absence of randomization
To resolve this problem a key element of a clinical trial, randomization, was invented. If we divide the participants in the trial between the two branches randomly we will get these confounding variables to be distributed homogeneously between the two arms of the trial, so any difference between the two will have to be due to the intervention. Only in this way can we establish cause-effect relationships between our exposure or treatment and the outcome variable we measure.
The problem of quasi-experimental and observational studies is that they lack randomization. For this reason, we can never be sure that the differences are due to exposure and not to any confounding variable, so we cannot safely establish causal relationships.
This is an annoying inconvenience, since it will often be impossible to carry out randomized trials either for ethical, economic reasons, the nature of the intervention or whatever. That is why some tricks have been invented in order to establish causal relations in the absence of randomization. One of these techniques is the propensity score we saw in an earlier post. Another is the one we are going to develop today, which has the nice name of regression discontinuity.
Discontinuity regression
Regression discontinuity is a quasi-experimental design that allows causal inference in the absence of randomization. It can be applied when 
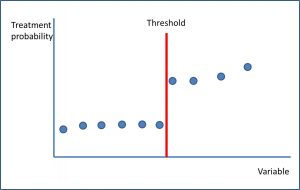
Consider, for example, a hypocholesterolemic drug that we will use when LDL cholesterol rises above a given value, or an antiretroviral therapy in an AIDS patient that we will indicate when his CD4 count falls below a certain value. There is a discontinuity in the threshold value of the variable that produces a sudden change in the probability of assignment to the intervention group, as I show in the attached figure.
In these cases where the allocation of treatment depends, at least in part, on the value of a continuous variable, the allocation in the vicinity of the threshold is almost as if it were random.
Why? Because determinations are subject to random variability by sampling error (in addition to the variability of biological variables themselves), which makes individuals very close to the threshold, above or below, very similar in terms of the variables that may act as confounders (being above or below the threshold may depend on the random variability of the result of the measurement of the variable), similar to what happens in a clinical trial. At the end of the day, we may think that a clinical trial is nothing more than a discontinuity design in which the threshold is a random number.
The math of regression discontinuity is not for beginners so I do not intend to explain it here (I would have to understand it first), so we will settle for knowing some terms that will help us to understand the works that use this methodology.
Types os discontinuity regression
Regression discontinuity may be sharp or fuzzy. In the sharp one, the probability of assignment changes from zero to one at the threshold (the allocation of treatment follows a deterministic rule). For example, treatment is initiated when the threshold is crossed, regardless of other factors. On the other hand, in the fuzzy regression there are other factors at stake that make the probability of allocation change in the threshold, but not from zero to one, but may depend on those other factors added.
Thus, the result of the regression model varies somewhat depending on whether it is a sharp or fuzzy regression discontinuity. In the case of sharp regression, the so-called average causal effect is calculated, according to which participants are assigned to the intervention with certainty if they cross the threshold. In the case of fuzzy regression, the allocation is no longer performed according to a deterministic model, but according to a probabilistic one (according to the threshold value and other factors that the researcher may consider important).
In these cases, an intention-to-treat analysis should be done according to the difference in the probability of allocation near the cut-off point (some may not exceed the threshold but be assigned to the intervention because the investigator considers the other factors).
Thus, the probabilistic model will have to measure the effect on the compliers (those assigned to the intervention), so the regression model will give us the complier average causal effect, which is the typical measure of fuzzy regression discontinuity.
We’re leaving…
And I think we’re going to leave it for today. We have not said anything about the regression equation, but suffice it to say that it takes into account the slopes of the probability function of allocation before and after the threshold and an interaction variable for the possibility that the effects of the treatment are heterogeneous on both sides of the threshold. As you see, everything is quite complicated, but for that are the statistical packages like R or Stata that implement these models with little effort.
Finally, to say only that it is usual to see models that use linear regression for quantitative outcome variables, but there are extensions of the model that use dichotomous variables and logistic regression techniques, and even models with survival studies and time-to-event variables. But that is another story…
