
Dispersion measures.
Some dispersion measures are described, such as the interquartile range, the deciles and the percentiles.
Those of you who’re reading and who belong to the pediatricians’ gang already know what I am talking about: the 50th percentile. There’s no mother who doesn’t want her offspring to be above it in weight, height, intelligence and everything else that a good mother could desired for her child. That’s why pediatricians, who dedicate our lives to children care, love percentiles so much. But what is the meaning of the term percentile?. Let’s start from the beginning…
Dispersion measures
If we have the distribution of values of a variable we can summarize it with a central and a dispersion measure. The most common are the mean and the standard deviation, respectively, but sometimes we use other measures of central tendency (such us the median or the mode) and of dispersion.
Interquartile range
The simplest of these other measures of dispersion is called range, which is defined as the difference between the maximum and minimum values of the distribution.
Let’s suppose that we collect the birth weights of the last 100 children born at our hospital and we order them as they appear in the table. The lowest value was 2200 grams, while the prize for the biggest goes to an infant who weighed 4000 grams.
The range in this case is 1800 grams but, of course, if we do not have the table and someone tell us just this, we couldn’t have much idea about how our babies are in size. This is why it’s usually preferred to give the range with explicit minimum and maximum values. In our case it would be from 2200 to 4000 grams.
If you remember how to calculate the median, you will see that it values 3050 grams. To complete the picture we need a measure that tells us how the rest of the weights are distributed around the median and within the range.
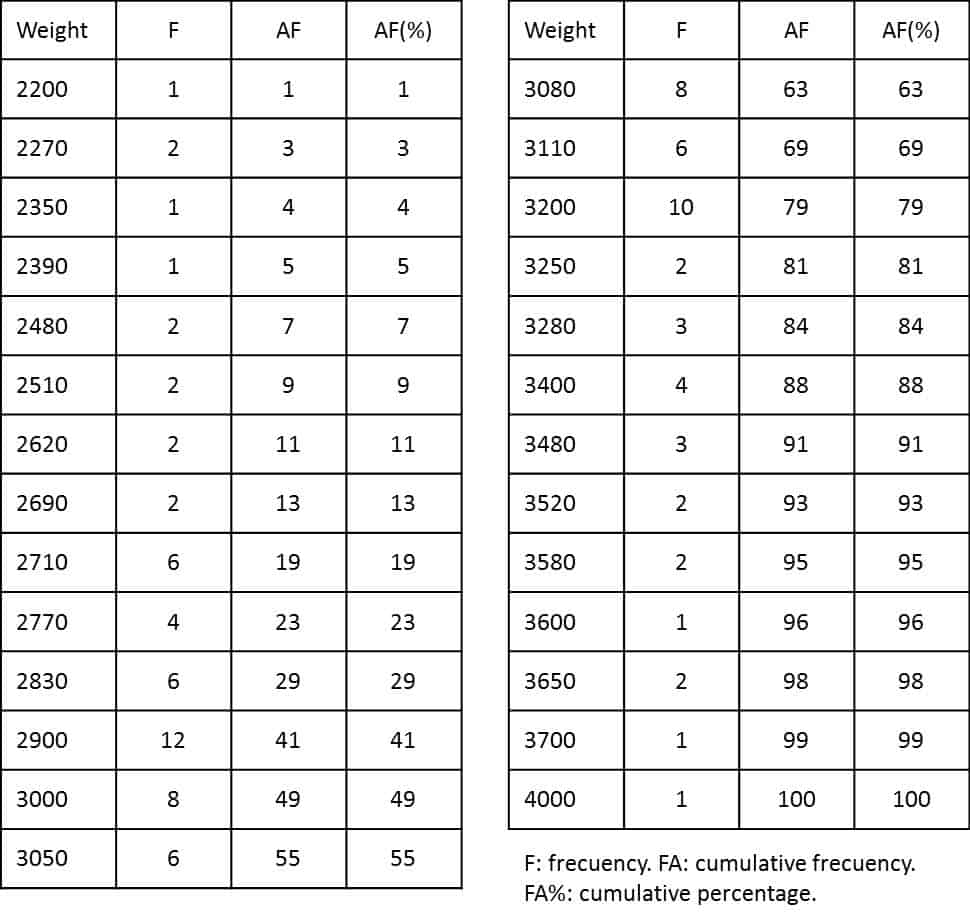
We come up with four segments: from the minimum to the first quartile, from the first to the second (median), from second to third and from third to the maximum. In our case, the three quartiles would be 2830, 3050 and 3200 grams. Some people call these the lower quartile, the median and the upper quartile, but they are the same thing.
Now if we know that the median is 3050 grams and 50% of children weight between 2830 and 3200 grams, we’ll have a pretty good idea about the birth weights of our newborns. This interval is called the interquartile range and it’s usually provided along with the median to summarize the distribution. In our example: a median of 3050 grams with an interquartile range from 2830-3200 grams.
Deciles and percentiles
But we can go much further. We can divide the distribution in the number of segments we want. The deciles are the result of dividing it in ten segments and our revered percentiles the result of dividing it in a hundred.
There is a fairly simple formula to calculate any percentile we want. For example, the Pth percentile would be at position (P/100)x(n+1), where n represents the sample size. In our distribution of neonates, the 22nd percentile would be (22/100)x(100+1) = 22.2, i.e. 2770 grams.
The sharpest of you may have noticed that our 3050 grams correspond not only to the median, but also to the fifth decile and to the 50th percentile, the desired one.
The great use of percentile, apart from to give satisfaction to 50% of mothers (those who have their children above the median), is to allow us to estimate the probability of a certain value of the variable within the population.
In general, the closer you are to the median the better it be (at least in medicine), and the further away from it the more likely that someone take you to a doctor to find out why you are not closer to the precious percentile or, even, something above it.
We’re leaving…
But if we really want to further refine the calculation of the probability to obtain a particular value within a data distribution, there’re other techniques related with the standardization of the dispersion measure we use. But that’s another story…
[…] upper one extends up to the maximum value of the distribution, but cannot go beyond 1.5 times the interquartile range. If there are more extreme values, they are represented as points beyond the end of the upper […]